main logo

kosrae Maps: land

Imagery

QuickBird

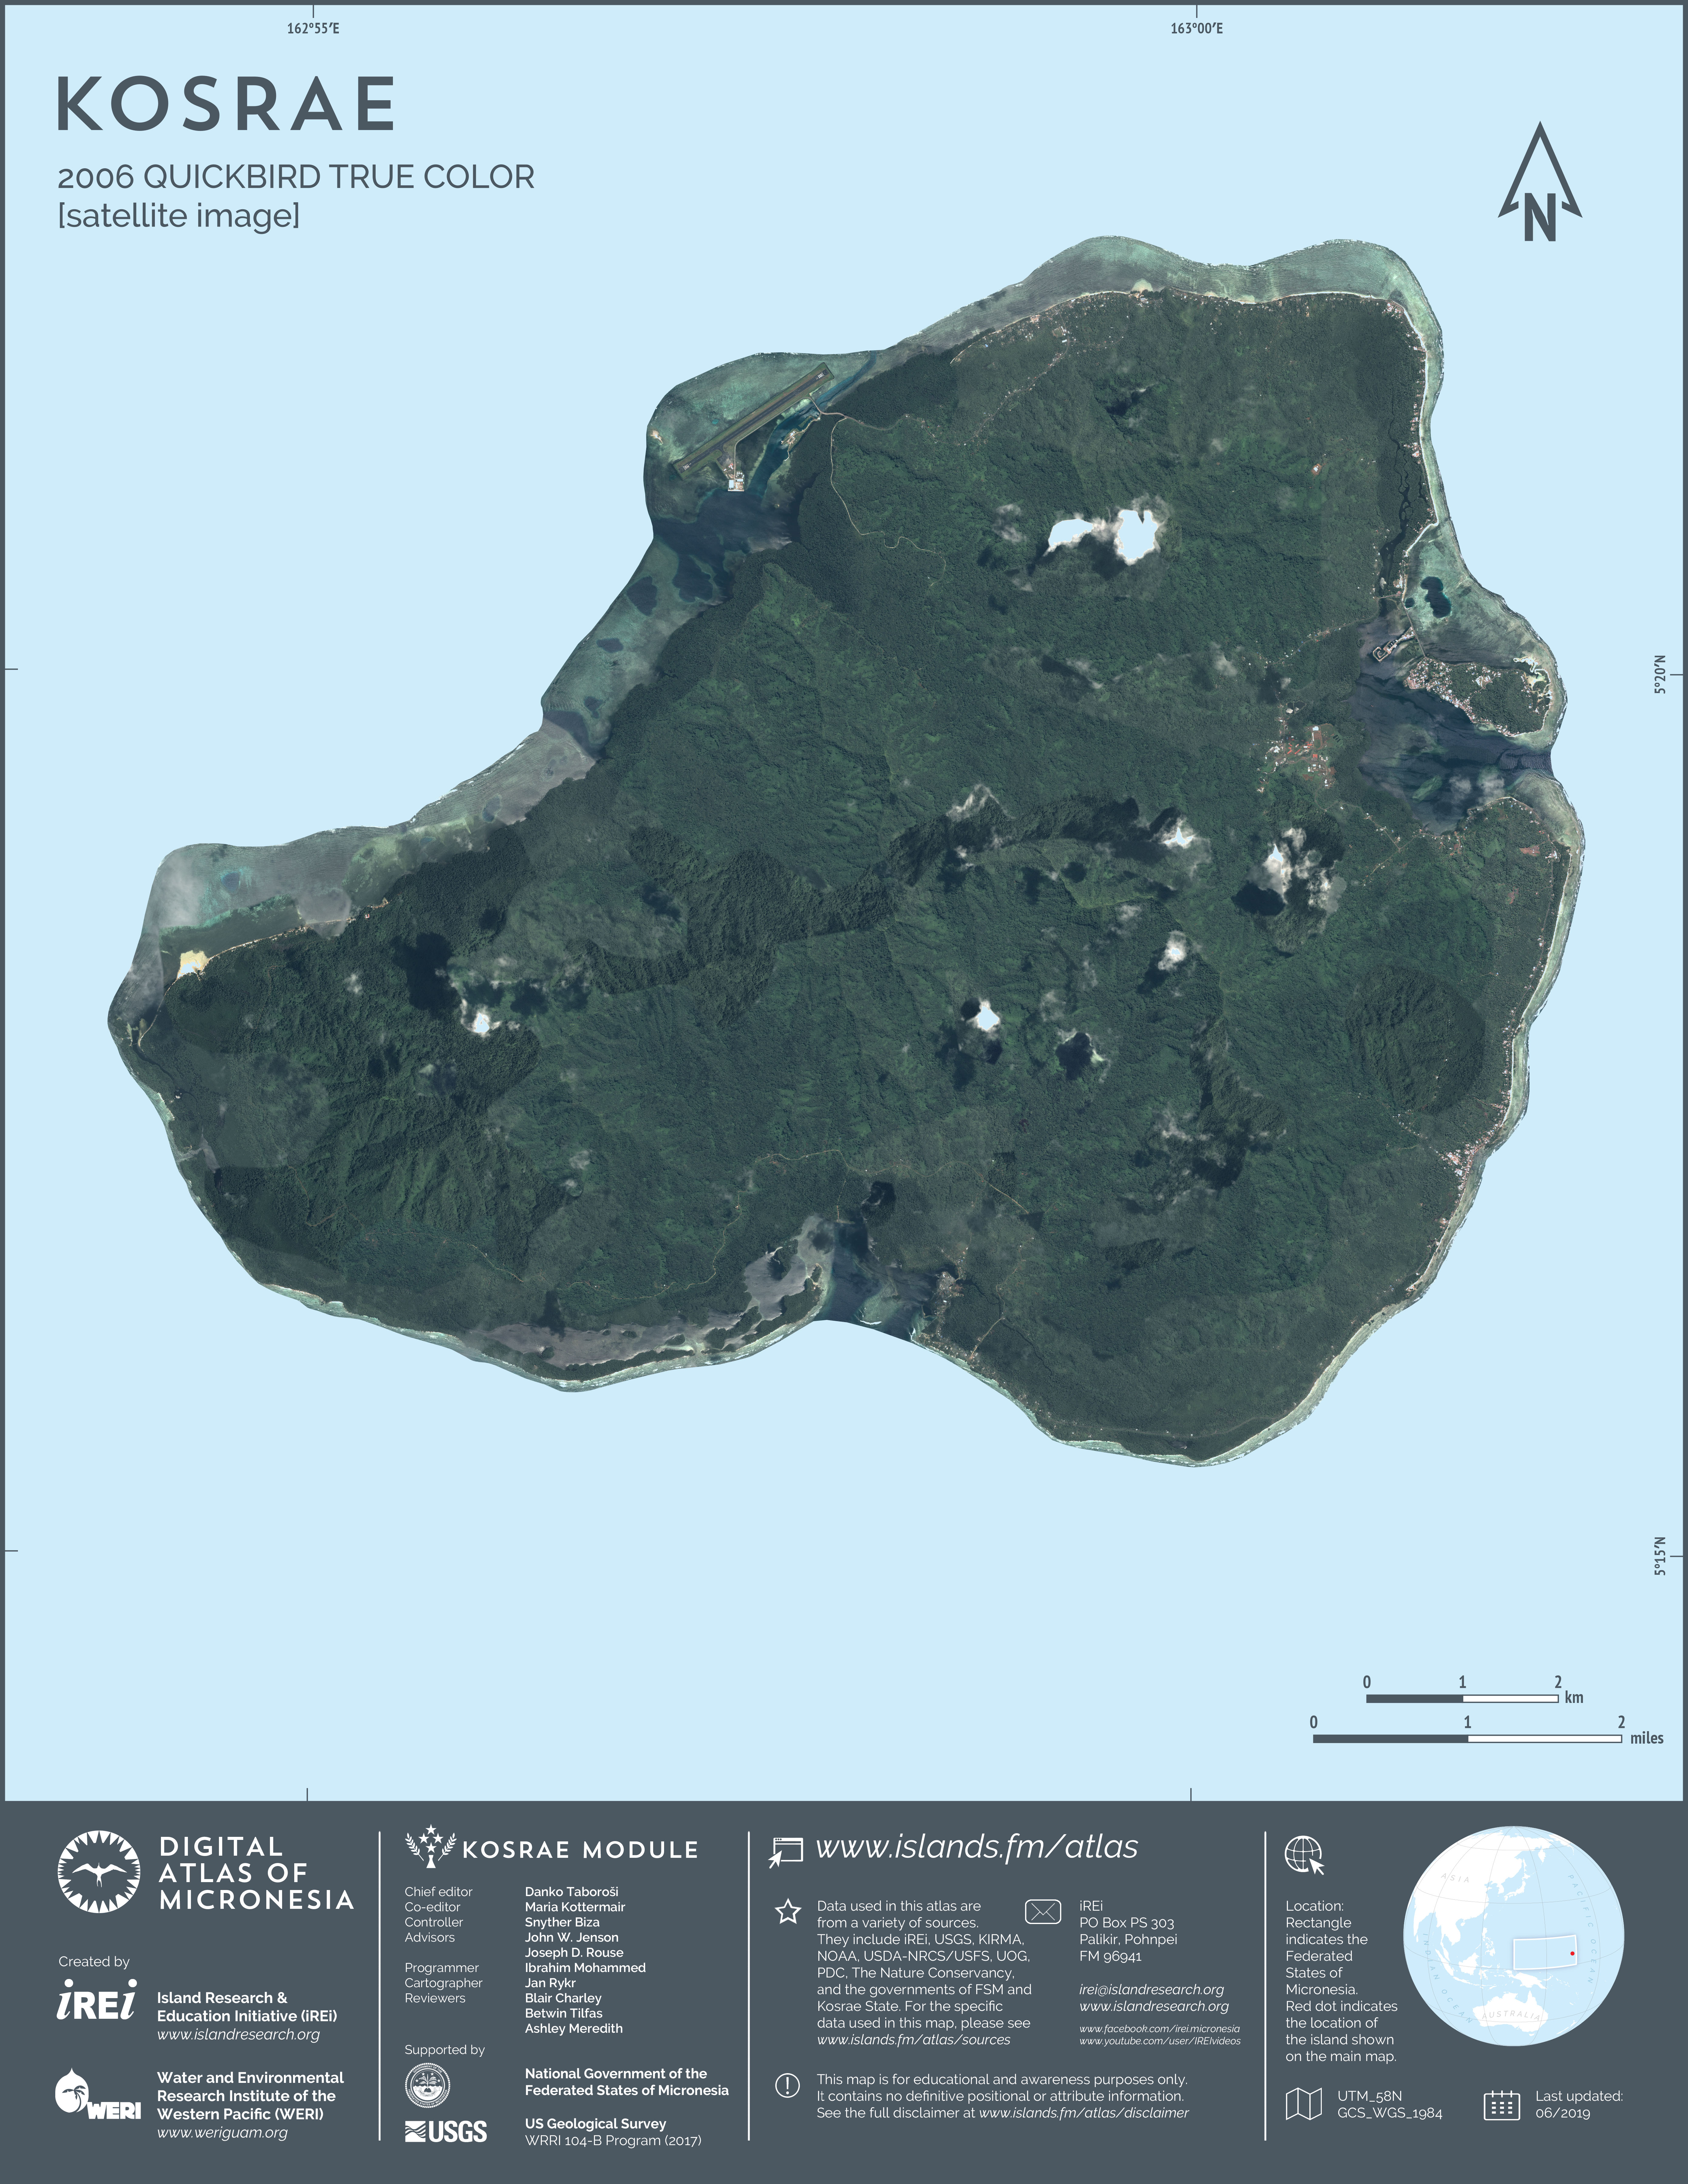
2004-2007 QuickBird satellite imagery orthomosaic [natural color]

This map showcases 2004-2007 satellite imagery of Kosrae taken by QuickBird satellite by DigitalGlobe. The data were purchased and processed by U.S. Department of Agriculture (USDA) – Natural Resources Conservation Service (NRCS). The image shown here is in natural color. Image portions that fall outside the barrier reef of Kosrae are omitted from the map.

2004-2007 QuickBird satellite imagery orthomosaic [color infrared]

This map showcases 2004-2007 satellite imagery of Kosrae taken by QuickBird satellite by DigitalGlobe. The data were purchased and processed by U.S. Department of Agriculture (USDA) – Natural Resources Conservation Service (NRCS). The image shown here is in color infrared. Image portions that fall outside the barrier reef of Kosrae are omitted from the map.

WorldView

2015-2018 WorldView-2 satellite imagery orthomosaic [natural color]

This map showcases 2015-2018 satellite imagery of Kosrae taken by WorldView-2 satellite by DigitalGlobe. The data were purchased and processed by U.S. Department of Agriculture (USDA) – Natural Resources Conservation Service (NRCS). The image shown here is in natural color. Image portions that fall outside the barrier reef of Kosrae are omitted from the map.

2016 WorldView-3 satellite imagery orthomosaic [natural color]

This map showcases 2016 satellite imagery of Kosrae taken by WorldView-3 satellite by DigitalGlobe. The data were purchased and processed by U.S. Department of Agriculture (USDA) – Natural Resources Conservation Service (NRCS). The image shown here is in natural color. Image portions that fall outside the barrier reef of Kosrae are omitted from the map.

Coast

Shoreline

Shoreline

This map shows the shoreline and the land area of Kosrae island, Lelu island, and smaller islands on the surrounding reef and in mangrove swamps. It actually contains two datasets: the shoreline itself and Kosrae base layer. Both were created by Island Research & Education Initiative (iREi) based on Digital Line Graphs (DLGs) from U.S. Geological Survey (USGS) 1:25,000-scale topographic maps. The shoreline and base layer were shifted and aligned with the current satellite imagery. In urban areas, the shoreline was updated using WorldView-2 satellite imagery from DigitalGlobe (2015-18) provided by U.S. Department of Agriculture (USDA) – Natural Resources Conservation Service (NRCS).

Topography

Elevation contours

10-m elevation contours [grayscale]

This map represents the topography of Kosrae. It shows elevation contour lines at 10-meter intervals. The contour lines are depicted in a range of colors corresponding to elevations from the shoreline to 630 m above sea level. They were derived by Island Research & Education Initiative (iREi) from a 10-meter resolution Digital Elevation Model (DEM) by U.S. Geological Survey (USGS) based on topography compiled in 1967 and the shoreline dataset representing the zero contour line.

10-m elevation contours [color]

This map represents the topography of Kosrae. It shows elevation contour lines at 10-meter intervals. The contour lines are depicted in a range of colors corresponding to elevations from the shoreline to 630 m above sea level. They were derived by Island Research & Education Initiative (iREi) from a 10-meter resolution Digital Elevation Model (DEM) by U.S. Geological Survey (USGS) based on topography compiled in 1967 and the shoreline dataset representing the zero contour line.

50-m elevation contours [grayscale]

This map represents the topography of Kosrae. It shows elevation contour lines at 50-meter intervals. Depicted in grayscale, the contour lines were derived by Island Research & Education Initiative (iREi) from a 10-meter resolution Digital Elevation Model (DEM) by U.S. Geological Survey (USGS) based on topography compiled in 1967 and the shoreline dataset representing the zero contour line.

50-m elevation contours [color]

This map represents the topography of Kosrae. It shows elevation contour lines at 50-meter intervals. The contour lines are depicted in a range of colors corresponding to elevations from the shoreline to 630 m above sea level. They were derived by Island Research & Education Initiative (iREi) from a 10-meter resolution Digital Elevation Model (DEM) by U.S. Geological Survey (USGS) based on topography compiled in 1967 and the shoreline dataset representing the zero contour line.

Elevation by color

Elevation intervals

This map shows the elevation of terrain on Kosrae. The dataset was derived by Island Research & Education Initiative (iREi) from a 10-meter resolution Digital Elevation Model (DEM) by U.S. Geological Survey (USGS) based on topography compiled in 1967. The DEM was classified into elevation intervals and colored based on elevation in meters above sea level.

Elevation range [color]

This map shows the elevation of terrain on Kosrae. The dataset was derived by Island Research & Education Initiative (iREi) from a 10-meter resolution Digital Elevation Model (DEM) by U.S. Geological Survey (USGS) based on topography compiled in 1967. The DEM is depicted as a range of colors based on elevation in meters above sea level.

Elevation range [grayscale]

This map shows the elevation of terrain on Kosrae. The dataset was derived by Island Research & Education Initiative (iREi) from a 10-meter resolution Digital Elevation Model (DEM) by U.S. Geological Survey (USGS) based on topography compiled in 1967. The DEM is depicted as shades of gray based on elevation in meters above sea level.

Relief

Shaded relief

This map shows the relief of terrain on Kosrae. The dataset was derived by Island Research & Education Initiative (iREi) from a 10-meter resolution Digital Elevation Model (DEM) by U.S. Geological Survey (USGS) based on topography compiled in 1967. The dataset was derived using the so-called hillshade function that creates an illusion of viewing terrain in 3D.

Shaded relief and elevation

This map shows the elevation and relief of terrain on Kosrae. It consists of two separate datasets, both of which were derived by Island Research & Education Initiative (iREi) from a 10-meter resolution Digital Elevation Model (DEM) by U.S. Geological Survey (USGS) based on topography compiled in 1967. The two datasets are a DEM classified into elevation intervals and colored and a hillshade layer. Combined, they produce hypsometric-tinted shaded relief seen on the map and give the illusion of viewing terrain in 3D while also providing elevation information.

Slope

Slope aspect

This map shows the slope aspect of the terrain on Kosrae. Slope aspect is the compass direction in which a particular slope faces. The dataset was derived by Island Research & Education Initiative (iREi) from a 10-meter resolution Digital Elevation Model (DEM) by U.S. Geological Survey (USGS) based on topography compiled in 1967.

Slope [degress]

This map shows the steepness of slope on Kosrae. The steepness here is expressed in degrees and illustrated by means of a color gradient. The dataset was derived by Island Research & Education Initiative (iREi) from a 10-meter resolution Digital Elevation Model (DEM) by U.S. Geological Survey (USGS) based on topography compiled in 1967.

Slope [percent rise]

This map shows the steepness of slope on Kosrae. The steepness here is expressed in terms of percent rise and illustrated by means of a grayscale gradient. The dataset was derived by Island Research & Education Initiative (iREi) from a 10-meter resolution Digital Elevation Model (DEM) by U.S. Geological Survey (USGS) based on topography compiled in 1967.

USGS topographic map

USGS topographic map (2001)

This is a topographic map of Kosrae. The topographic map, 1:25,000 scale, was first published by the U.S. Geological Survey (USGS) in 2001 as a paper document. The map was later scanned and georeferenced to create what is commonly referred to as Digital Raster Graphics (DRGs). Island Research & Education Initiative (iREi) (2020) converted the original PDF files to GeoTIFFs. In the map shown here, portions of the DRG that fall outside the barrier reef of Kosrae are omitted.

Soil and Hazards

Soil

Basic soil types

This map shows the basic soil types of Kosrae. The original dataset was created by the U.S. Department of Agriculture (USDA) – Natural Resources Conservation Service (NRCS) (1983) as part of the soil survey of the Islands of Kosrae, Federated States of Micronesia at 1:10,000 scale. Soil map unit delineations were confirmed as accurate during a subsequent evaluation (1999). The data layer was created by Island Research & Education Initiative (iREi) (2019) by extracting and formatting a subset of the Gridded Soil Survey Geographic (gSSURGO) Database for Federated States of Micronesia (2019) created by USDA-NRCS.

Geology and Physiography

Physiography

General physiography

This map shows the general physiography of Kosrae. The data layer was created by Island Research & Education Initiative (iREi) (2019) using a combination of 10-meter resolution Digital Elevation Model (DEM) by the U.S. Geological Survey (USGS) and the simple soil map of Kosrae (NRCS, 1981), them applying it to the base layer (iREi, 2019).

Landmarks

Prominent peaks

Prominent peaks

This map shows the locations of prominent peaks on Kosrae. This data layer was developed by Island Research & Education Initiative (iREi) (2019) by manually digitizing features from the topographic map of Kosrae, 1:25,000 scale, published in 2001 by the U.S. Geological Survey (USGS). Note that the actual names contained in the dataset are copied from the source map and are not necessarily correct or aligned with Kosraean orthography.

Prominent caves

Prominent caves

This map shows the locations of prominent caves on Kosrae. The data layer was formatted for GIS by Island Research & Education Initiative (iREi) (2019) from location information provided by Kosrae Island Resource Management Authority (KIRMA). It should be noted that Kosrae has no karst terrain whatsoever, so caves found on the island are all in volcanic bedrock. The natural caves are lava tubes.